Exploring the Legitimacy of NBA All-star Voting Process
- Jiehwan Yang
- Dec 30, 2016
- 8 min read
Updated: Jun 10, 2021

Background Information and Motivations
NBA All-star had repeatedly come under strong criticism from many players, fans, and other important stakeholders alike. There are players like Kobe Bryant, who benefits from his long-standing popularity and reputation and was voted as one of the 2015 NBA All-star players despite of the mediocre season battling with constant injuries. On the other hand, there are players like Damian Lillard and Demarcus Cousins, who do not receive as much attention from media and recognition from fans and did not make it to the 2015 NBA All-star team despite of superb and record-breaking season. Damian Lillard famously tweeted, “I’m definitely going to take it personal. I said I’d be pissed off about it, and I am.”
This controversy around NBA All-star voting stems from its voting process, which selects NBA All-star players solely relying on the Internet and text message ballot from the fans. By utilizing fan voting, the current voting process suffers from a couple of systematic problems:
1. Only a very small percentage of fan votes is from NBA followers or experts. It automatically leads to uninformed popularity contest rather than basing it on ability.
2. Celebrities, or anyone who are opinion leaders, also influence the voting by endorsing a player of the same demographic, such as nationality. Due to these reasons, many expressed their dissatisfaction toward and questioned the legitimacy of NBA All-star events in general. Dallas Mavericks owner, Mark Cuban, has claimed that the NBA should get rid of the fan ballot entirely.
With the NBA All-star games always being the the source of contention, it leads to the important question: does popularity trump ability when it comes to the NBA All-star? In other words, are basketball statistics/high performance good predictors to determine if a player will make it into the NBA All-star team?
The purpose of this project is to explore the predictability of various basketball statistics on whether a player will make it into the NBA All-star team or not.
The results from this project will help better evaluate the strength and the legitimacy of the current voting process and will appeal to various stakeholders of the NBA, ranging from the fans and the players to the NBA commission and the team owners.
The next section, methodology, will cover different steps I took to collect, cleanse, and analyze the data and the thought-process behind each step. Then the results of the data mining will be presented and discussed at the end of the post.
Methodology
1. Data Collection
I gathered two different NBA basketball datasets from KDNuggets.com. The first dataset (D1), basketballplayers, is the detailed basketball stats records of every single NBA player in each year from 1950 to 2009. Each observation in D1 is a player in one season, and the attributes include typical basketball stats measurements such as points, rebounds, assists, blocks, etc. The second dataset (D2), ‘basketball_allstar,’ is the similar to the first dataset but the data are limited to only all-star players. Just as it was described in D1, D2’s observations are all-star players in each season, and the attributes characterizing these observations are the same as D1.
2. Data Cleansing and Preprocessing
The first step of data preprocessing was merging D1 and D2 together, so that there is one consolidated dataset (D3) with every single NBA player in each year with the additional attribute that indicates if respective player was in the All-star team or not in that given year. This merging was done in the Excel spreadsheet.
The next step involved working with missing data and dirty data. GS (games started) column was removed since all the values were 0 in all observations. I dropped all observations before the year of 1980, since the merger between NBA and ABA happened in 1976, because before that, the way basketball statistics were measured and recorded was different between those two leagues. For the sake of easier data analysis, I dropped everything before 1980. Furthermore, after data exploration, I found that the list of All-star players in 1998 is empty, so I decided to exclude the year 1998 as well.
The final dataset that had been “cleaned” up has a total of 36 variables. Only 32 out of those 36 variables will be utilized as predictors for the analysis. There was a total of 685 All-star player appearances between 1980 to 2009, except 1998. Summary statistics on those 32 predictors are shown below:

Note that predictors that start with "post" are basketball stats during post-season.
Trend Exploration using Tableau
Before the actual data mining analysis took place, high level data exploration was conducted using tableau. The goal was to identify any interesting patterns or trends in a non-calculative manner by comparing the basketball statistics between the All-star players and non-All-star players across time.
All-star (Blue) vs. Non All-star (Orange)

I believe that teams play an important part in All Star draft process. More often than not, basketball players from a world-famous popular team would be more likely to get on the All Star team of the year. The team fan base contributes to a big part of the votes.
As the graph shows, ATL, PHO, and SEA have the most all-star players on their teams.
Due to limited resource, I am unable to capture the semantic facts about the teams throughout basketball history. It is hard to take team M&A into account when looking at the trend. However, I do believe this graph provides a good sense of the importance of team popularity.
Note that the following charts on the right side are from post seasons.
Three point Throw Rate


Blue line shows all star.
Green line shows non all star players rate.
Orange line shows all players.
Assists


Block


Field Goal Rate


Free Throw Rate


Game Played


Playtime


Points Made


Steals


Overall, the visualization demonstrates the All-star players do perform better in all aspects of basketball statistics. Furthermore, there was an uneven distribution in teams out of all All-star players. More often than not, basketball players from a world-famous popular team would be more likely to get on the All Star team of the year. The team fan base contributes to a big part of the votes. The graphs clearly show the disparity in basketball statistics between All-star players and non-All-star players.
Classification Analysis

Decision Tree
As I an trying to classify which players are more likely to be an all-star based on given data attributes, I utilized one of the categorical prediction methods, decision trees. Decision trees allow us to predict categorical labels of the dependent variable using other available attributes in a visually appealing format (includes at which attribute and value each node splits).
I first evenly partitioned the data into training and test data by 50 percent respectively. After partitioning the data, I created several decision trees with different “minsplit” values. The minsplit value represents the minimum number of observations that must exist in a node in order for a split to be attempted. In other words, a decision tree with a minsplit value of 100 only splits on attributes that have 100 observations. Therefore, it is important to try different minsplit value in order to find the best performing decision tree. The decision tree with a minsplit value of 20 has an accuracy rate of 96.2%.
Also, it is important to note that the first split and second split are always “points” and “PostRebo” (rebounds) and therefore are the most crucial determining factor to be an all-star.
I explored the strength of decision trees by changing the minsplit parameters between 10, 20, and 60. Confusion matrices were utilized to calculate accuracy, precisions, and recalls. It is important to note that I prioritize the predictability of someone making into All-star team than not making into one. Furthermore, I believe that FN is more costly than FP, because most of the dissatisfactions from stakeholders are caused by well-deserved players not making to the team.


Try minsplit=10:


Try minsplit=60:


Let's look at how each minsplit performed.

Let's take confusionmatrix1 and calculate its accuracy, precision, and recall.

K-Nearest Neighbor
I also utilized k-nearest neighbors (k-nn) method to compare which method performs better in predicting all-star players. The idea of k-nn is to identify k observations in the training dataset that are similar to a new record into a class, assigning the new record to the predominant class among these neighbors. I thought k-nn would be another great classification method to use because it does not make assumption about the form of the relationship between the class membership and the predictors. It does not involve estimation of parameters in an assumed function form, such as the linear form in linear regression. Instead k-nn method draws information from similarities between the predictor values of the records in the data set.


Although choosing a higher k value reduces the risk of over-fitting due to noise in the training data, I also did not want k to be too high in order to balance out over-fitting to the predictor information and ignoring this information completely. I also used an odd number for k to avoid ties.
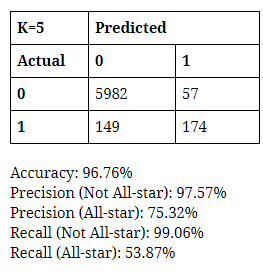
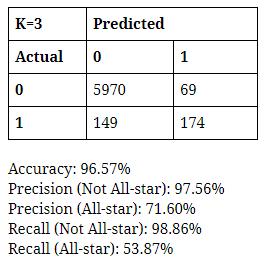
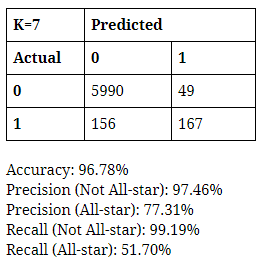
To maximize the performance of the model, I varied the K-value parameter from 3 to 7 (odd numbers only). I made confusion matrices for each K-value and calculated accuracy, precisions, and recalls to measure how well each performs. Once again, I prioritized the predictability of someone making into the All-star team over that of someone not making into one. In addition, I regard FN as much more important and costly than FP, so I aim to choose the model that minimizes FN and maximizes Recall and Precision of All-star. Based on these values, I did not observe significant difference in performance between the decision tree and K-NN. I chose one of each that does the best at minimizing the cases of FN, while maintaining relatively high values of precision and recall of All-star--the decision tree with minsplit value of 10 and K-NN model with the K-value of 3.
Conclusion
It is not surprising to discover that All-star players in general have better basketball statistics than non-All-star players, because it is only intuitive to conclude that the popularity of a given player is positively correlated with his ability to play basketball. It was interesting to find the high discrepancy in the number of All-star players throughout the team. I did not take the establishment of each team into consideration, but it is safe to assume that the probability of making into the All-star team is different from one team to another due to their popularity, fan base, and ability.
Through the decision tree and the K-NN model, I found that basketball statistics are relatively reliable information to predict whether a player will make into the All-star team or not. In terms of predicting if someone will NOT make the team, both techniques were highly accurate and viable (precision and recall both over 97%). This, as it was mentioned, is not very meaningful, since there are simply more players who do not get selected into the All-star team thus much higher chance of not making it. They had more difficulty in predicting if someone will make the team, as the decision tree had precision and recall of 62% and 55% and K-nn had 69% and 49%. The fact the recalls are so low would be quite costly if these models were to be deployed since false negative in this case would cause a lot of dissatisfaction among stakeholders, more so that false positive.
All in all, the fact that basketball statistics are somewhat reliable information to predict someone’s chance at making the All-star team indicates that the current NBA All-star voting process is not as bad as what people think. This is based on the widely accepted notion that popularity is positively correlated to one’s ability to play basketball. There always will be outliers, such as Kobe Bryant making it to the All-star team, but I can safely conclude that in general players who are fan voted to join the All-star team are definitely talented, superior to, and perform far better than non-All-star players.


![[Internship] QA Data Analyst: Using Text Mining to Find Similar Bugs in the Past](https://static.wixstatic.com/media/bf2529_928f70501a5247638fe3f8df15e48bfc~mv2.jpg/v1/fill/w_980,h_735,al_c,q_85,usm_0.66_1.00_0.01,enc_avif,quality_auto/bf2529_928f70501a5247638fe3f8df15e48bfc~mv2.jpg)
Comments